")
")
")
")
")


MasterPrint is a high-class technical indicator for the MetaTrader 5 and MetaTrader 4 trading platforms, which was created by our masters due to the lack of a complete analysis of market volumes in the MetaTrader platform.
MasterPrint was created for hedge fund managers of our company with the goal of a more detailed analysis of the volumes of clusters and footprints, but then our masters decided to give this indicator for free to all our customers so that all our customers could understand the volumes on the market and thereby increase their profit from trading in financial markets.
Trading indicator MasterPrint is the best volume indicator in the world for MetaTrader, written in MQL.
Free for our customers
Each of our clients will be able to receive a MasterPrint volume indicator by filling out a form to receive an indicator on this page of the site or write to us by email -
Features of MasterPrint in the MetaTrader 5 and MetaTrader 4 Platform
Benefits of MasterPrint
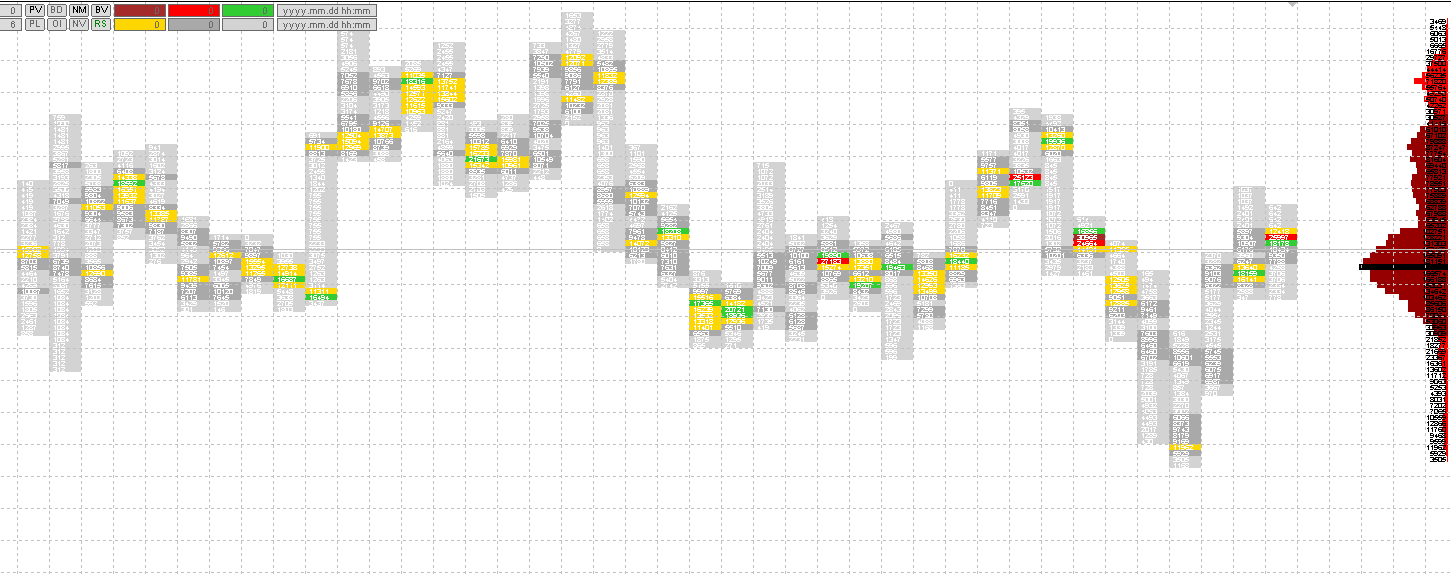
MasterPrint is a volume indicator that takes its data from traded contracts with Time & Sales (tape, prints) and in real-time projects this volume onto the chart by clusters.
In any market, all price movements occur from volume to volume, where volume and trade are accumulated. About 90% of traders lose their money in the market only because they use an incorrect trading system with a lack of understanding of the market process itself. 99% of all technical indicators are late and follow the volume, and therefore are not very informative.
Our MasterPrint indicator comes with the price and shows really traded volumes with the ability to configure on your chart - show traded contracts or ticks.
The MasterPrint indicator calculates volume clusters by prints, sorts them according to fullness and marks them with a specific color. In addition, the indicator summarizes all prints in clusters and displays the result on the price axis, as a horizontal volume scale, that is, in the form of a market profile.
The indicator works on all periods available in the terminal, but uses historical data for smaller (relative to the current) periods M1, M5, H1, H4 and D1 for calculations. The indicator produces all constructions only in the visible viewing area of the chart, but scrolling to the history is possible. At the moments of scrolling of the chart, clusters may flicker, this is normal, as they are recounted. Clusters that have the same color but different lengths (within the limits of a single price line) are approximately equivalent in volume content.
Indicator Description
BSP - increment / decrease of a fixed step of the price grid. It is set in the "old" paragraphs. If the value is zero, the calculation step is taken from the parameter set by the BSPP button.
BSPP - increment / decrease of the dynamic step of the price grid. Set in monitor pixels.
PV - turns on / off the display of the volume profile.
PL - volume profile left / right.
BD - in this mode, each cluster does not contain volume, but its concentration. The cluster volume may not be very large or even imperceptible, but if its concentration per unit time is high, this indicates a high trading activity on this candle / candles, at this price level.
OI - turns on / off the mode of open interest obtained mathematically by successively zeroing mutually absorbing volumes. Only volumes that were not affected after this operation remain for display in clusters and in the profile.
NM - turns on / off the line-by-line gluing mode of neighboring clusters.
NV - in this mode, the volume scale is not taken into account at all, the fullness of the clusters and profile is calculated according to the TPO principle.
BV - turns on / off the display of period frames.
RS - reset to default settings.
Input variables
BordresFontSize - font size of labels over period frames.
Clusters are automatically sorted in increments of 1/6. As a result, we have six color gradations. The color matching of these gradations for clusters can be configured with color variables:
LowBoxColor - up to 2/6,
MiddleBoxColor - up to 3/6,
MediumBoxColor - up to 4/6,
HighBoxColor - up to 5/6,
HighestBoxColor - up to 6/6
Manual sorting of clusters is set by the user using input variables: HighestBoxValue, HighBoxValue, MediumBoxValue, MiddleBoxValue, LowBoxValue,LowestBoxValue, in which the upper limit of the cluster volume is indicated, above which the cluster acquires the corresponding color.
The remaining input variables relate to other color settings, and their purpose becomes clear from their name.


